Data
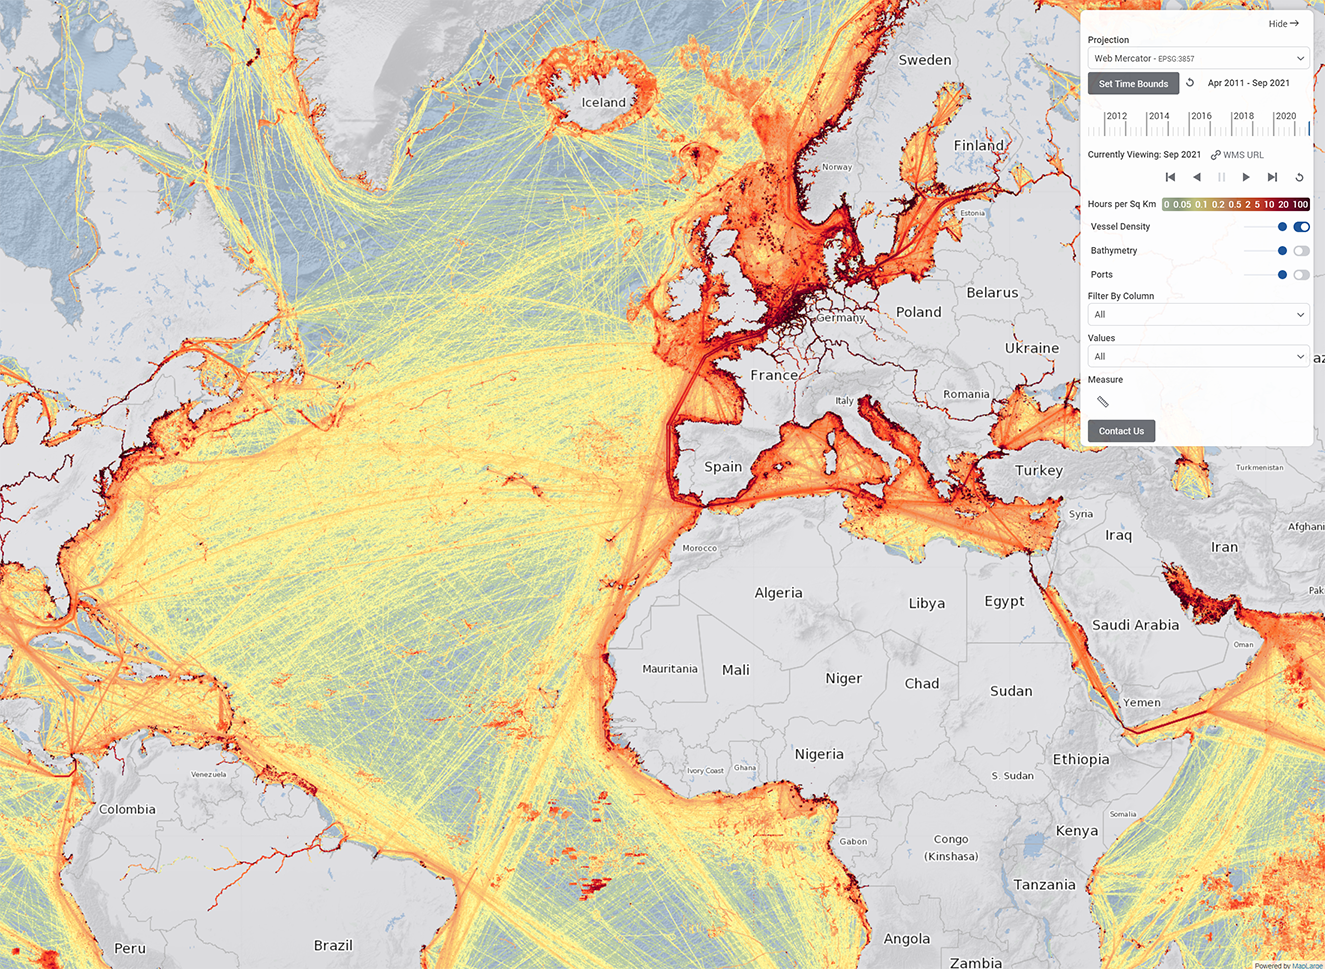
The goal of the Global Maritime Traffic Density Service (GMTDS) is to provide access to the most up-to-date marine traffic information by building on a foundation of collective data and knowledge, and leveraging access to cutting edge geo-analytics and massive computing power. To date, GMTDS has processed over 100 billion AIS messages spanning more than ten years of historical data from a variety of data providers, resulting in roughly 550 billion processed density values.
Methodology
GMTDS processes are closely modeled after the EU Vessel Density Map Detailed Method published by the European Marine Observation and Data Network. To generate traffic density rasters, location data from raw AIS messages is transformed into a series of unique vessel tracks. The resulting track data is subjected to both manual and algorithmic processing to identify and remove bad data from the system. The following steps are taken to ensure end users have access to the highest quality data.
1. AIS Data Cleansing & Processing
(Millions)
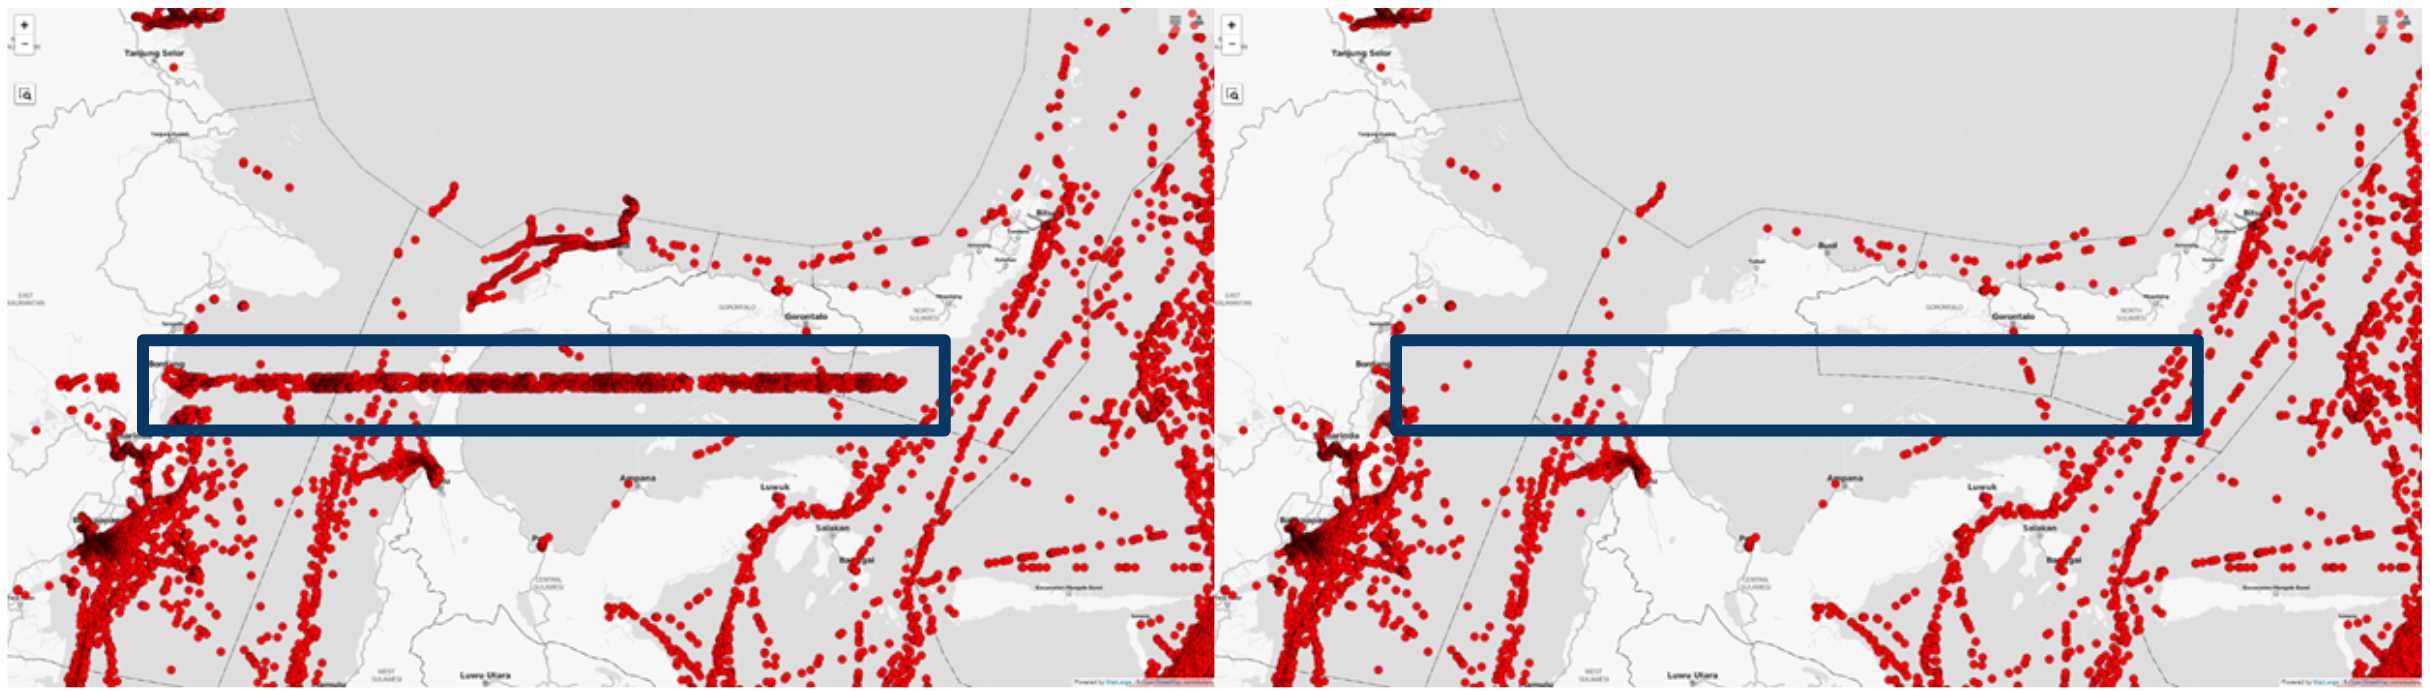
2. Identification and Removal of Abnormal Activity
A variety of manual and algorithmic processes are applied to identify and remove anomalous and erroneous data.
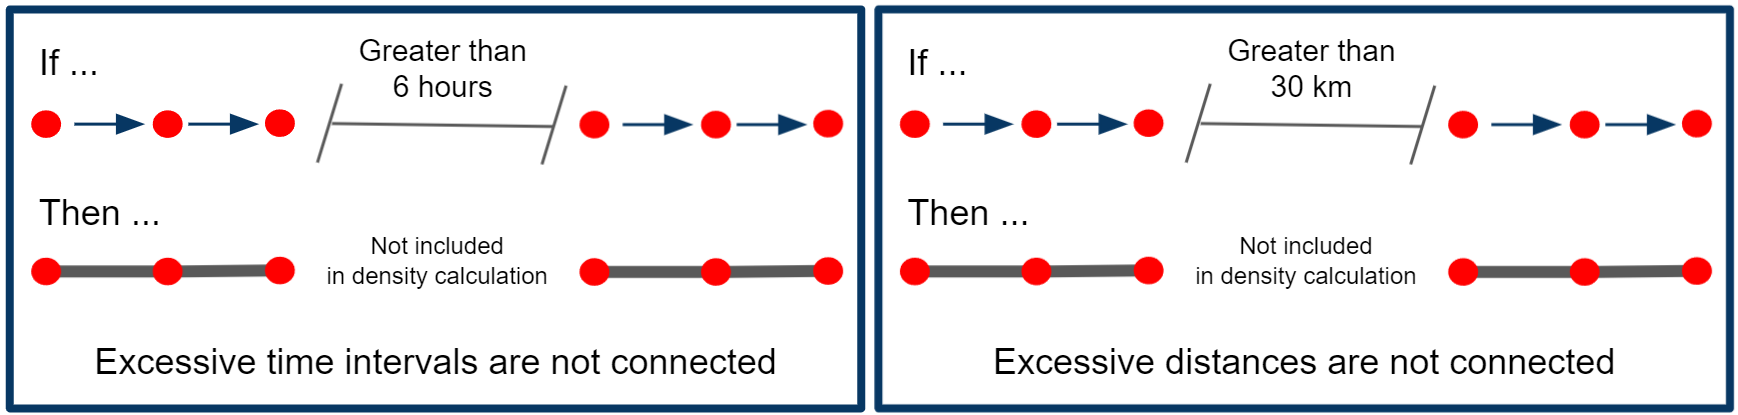
3. Analytic Processing to Create Vessel Tracks
Geoanalytics are used to transform AIS location messages into continuous vessel tracks, with logic in place to segment tracks where appropriate.
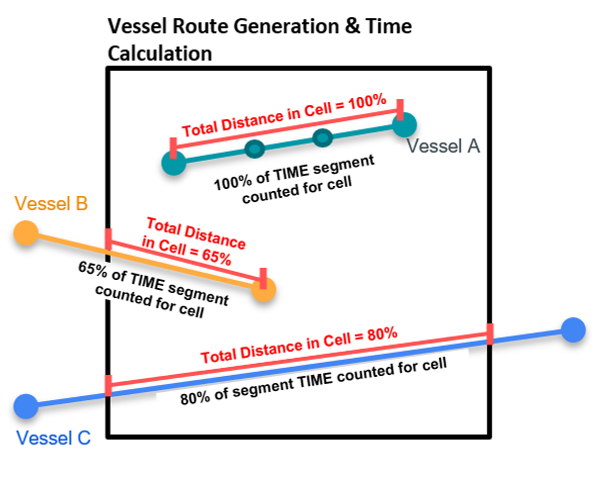
4. Vessel Density Calculation and Raster Development
Cleansed vessel track data is used to generate a 1 km2 time-density grid. Time values for each grid cell are calculated as the sum of the time component for all track segments overlapping the cell in a given month.
Projections
Raster grids are made up of uniform sized cells. Since many projections do not preserve relative geographic area as latitude changes, cells at more extreme latitudes have a lower actual area than cells at moderate latitudes. GMTDS compensates for this by scaling the vessel density in each cell according to its actual geographic area. This phenomenon also occurs if the raster is warped or reprojected directly. The resampled cells in the new projection may no longer contain the same data relative to the original grid and color scale. To facilitate data visualization over a variety of geographical areas, GMTDS offers the following projections:
- WGS 84 (EPSG:4326)
- Web Mercator ( EPSG:3857)
- Arctic (EPSG:3995)
- Antarctic (EPSG:3031)
Depending on the use case and geographic area of interest, certain map projections may be more suitable. Cylindrical projections such as Web Mercator do a good job of representing relative distances and sizes of objects at moderate latitudes, but near the poles there are areas of increased visual distortion. Objects which are small appear larger, and objects which are close together appear more distant from each other. In those cases, an alternative projection family such as Polar Stereographic (Arctic & Antarctic) may be preferable.
Metadata
GMTDS includes a basic ISOTC211/19115 endpoint that automatically generates an XML description of the WMS layer. To access this endpoint, append the WMS layer identifier to the URL in the following format:
Raster Downloads
Raster Data can be exported for consumption in external services & software in GridFloat, NetCDF, and TIFF formats. To request a bulk download, please use the contact us form.